One week to AEZOPS!
We are one week into our glider mission in the Ross Sea and the glider is doing great! Since the deployment and our adventure under the ice, the glider has gone over 150 km (93 miles) toward the NE. The conditions in the open water of the Ross Sea Polynya have been great.
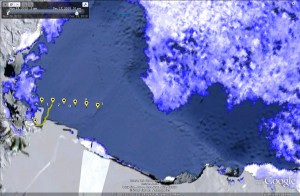
The above map shows the deployment location and the path the glider has taken so far in yellow. The ice conditions are also shown as blue and white shades surrounding the glider’s path. As the mission continues, this ice cover will continue to melt with the warmer summer conditions. Each day the open water of the polynya grows.
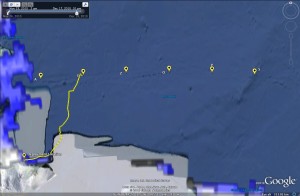
A close up view shows more detail on the path the glider took. You may notice that it is not very straight. It is the job of our glider pilots to get the glider to the waypoints as efficient as possible. While the glider is traveling the depths of the Ross Sea it is effected by the ocean currents. Depending on how strong they are, they can have a big impact on where the glider goes. So our pilots need to account for this as we pilot the glider to the north and east. The result is a wobbly path toward our intended waypoint (Station E of the AEZOPS Line). More AEZOPS later in the post…
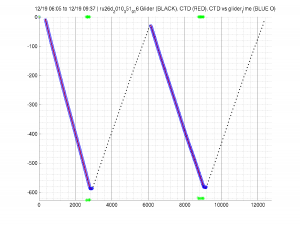
This first week is also a time for our engineers to tune the glider. We have the ability to adjust how it is flying in order to make sure we are gliding as efficiently as possible. Some of the sharp turns you see in the path are small experiments they are running to see what impact it has on our flight. The above image is an example of some of the information they use to asses the glider’s flight. It shows a two dive segment with depth on the y-axis and a measure of time on the x-axis. You can see two nice dives to about 600 meters depth. The black dots are the glider’s path, the red shows when our science sensors are collecting and returning data and the green are the altimeter pings on the seafloor. The glider uses those important pings to determine when to turn around and head back toward the surface before hitting the seafloor. Throughout the mission the engineers will monitor these settings and others to make sure the glider is optimized for the cold conditions of the Ross Sea.
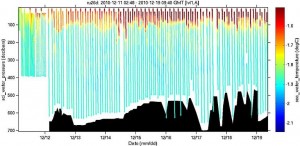
So how cold is it?? The glider knows. Ocean temperatures are constantly monitored as our robot glider from the surface to the dark depths. The plot above show the temperature data we are getting back from the glider during the first week of flight. The y-axis is shown depth and the x-axis is time into the mission. The color of the dots indicates the measured temperature. The scale on the right shows that the temperatures are ranging from about -1.9 to -1.4 degrees!!!! The salt is the only thing keeping this water from freezing. You can also see that the water is ‘warmest’ on the surface and gets colder as you go deeper. I am still amazed that I can sit here in my living room in New Jersey and observe the ocean conditions 9,000 miles away in the Ross Sea, all in real-time!!
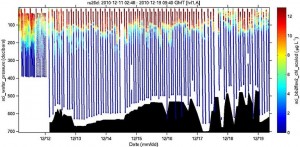
This warmer water is helping to support a large bloom of phytoplankton that form the base of the food web in the Ross Sea. In addition to temperature our glider is able to measure the concentration of the phytoplankton along its path. The plot above shows that the phytoplankton is up in the warmer layer near the surface. This layer keeps the phytoplankton cells near the surface where there is plenty of sun and nutrients to grow.
So what is AEZOPS? In the above maps you can see a series of points with the letters A-E-Z-O-P-S. These mark the location of sampling stations that have been occupied during previous experiments in the region. It is data collected along this line of stations that motivated our study. Here is where they have found MCDW in the past. MCDW is the warm water our experiment is focused on. Now that the glider reached station E, we will turn toward the east and run the line.
Lets all watch and see what the glider tells us about conditions along AEZOPS!


 December 18, 2010


2 Responses to “One week to AEZOPS!”