Getting to Know MCDW
We’ve talked a lot about Modified Circumpolar Deep Water recently. It’s the water that our gliders are looking for, and our scientists think the nutrients it carries cause the great blooms of food during the Ross Sea’s summers. Let’s take a day to get to know it.
MCDW starts out in water 400 meters (1320 feet) or more below the surface of the Southern Ocean. It travels around and around Antarctica as part of an enormous current called the Antarctic Circumpolar Current (‘circumpolar’ just means ‘around the pole’). If you add up all the water in all the world’s rivers, the Antarctic Circumpolar Current carries about 100 times that total.
At the opening of the Ross Sea, some of that water gets pushed by the tides and jostled by the rotation of the Earth until it breaks off from the circumpolar current. It begins flowing into the Ross Sea, carrying with it characteristics of the water it came from, including a temperature of about 30°F to 32°F and a salinity value of 34.5 to 34.6. It also carries deep-water nutrients such as iron toward the shallower, sunlit waters of the Ross Sea.
When our scientists look at data from a CTD or glider, these characteristics make it easy to recognize MCDW. But temperature and salinity have a more important effect, too: they determine how dense the water is. And that determines where the MCDW moves. Read on through the slideshow to find out more, and for a chance to discover Modified Circumpolar Deep Water in your own data plot:
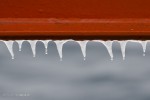
- Summer in Antarctica is a relative thing—today the temperature dropped by 10° Fahrenheit and these ‘ice teeth’ began to form on our ship’s railings. But there’s still plenty of sunlight, and that can mean immense growth of plankton and krill—as long as the water contains enough nutrients. That’s why we’re on the trail of Modified Circumpolar Deep Water—the scientists think that the MCDW carries nutrients into the Ross Sea, making conditions right for marine plants to grow.
- Looking at waves and wind playing on the surface of a lake or ocean, it’s easy to see how confused the water gets. Down deep, water is also moving in many different directions—it’s not still like the water in a fish tank down there. The difference is that it’s not wind that makes those currents move, but things like tides, the rotation of the Earth, and most importantly, differences in the density of the water.
- Sometimes the telltale signs of MCDW are easy to spot; other times they are harder to be sure of. That’s because as the water flows farther inland, it begins to mix with the surrounding water and loses some of its distinctiveness. The science team spent part of this morning discussing what their data indicated. Here, Dr. Phoebe Lam points out a detail on a glider plot to Drs. Josh Kohut, Adam Kustka, and Allen Milligan. Katie Watkins-Brandt, Dr. Peter Milne, and Lora McGuinness look on.
- In the afternoon a one-year-old Adélie penguin swam up to the ship and took a look at us. It was a treat to see, and also a good visual example of how density works. This penguin, with its fluffy feathers and thick layer of blubber, is less dense than the water. That’s why it floats so high. Water masses behave in a similarly when they have different densities (if their temperature or salinity are different)—one rises above the other. For example, MCDW is less dense than the very cold, very salty water at the bottom of the Ross Sea. That’s why we find it at medium depths, instead of on the bottom.
- You might wonder what makes two bodies of water have different densities. The answer is weather, and this ice is a good example. The cold air in Antarctica can chill or freeze surface water, quickly making it colder than the water just below it. At the same time, when water becomes ice it leaves its salt behind, making the remaining water much saltier. Both these actions can make the surface water very dense—dense enough to sink to the bottom of the sea and let water below it rise to the surface. (Note: Chris took this photo of ice floes in front of Mount Discovery a few days ago—we haven’t seen ice in two days now).
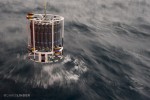
- This is why CTD information is so important to oceanographers: it helps them to locate water they’re interested in. MCDW is very distinctive: it’s warmer than the water above it, but it’s also more salty. Overall, that makes the MCDW more dense, so it stays beneath the surface water.
- Another telltale sign of MCDW is that it has less oxygen dissolved in it than the surrounding water. That’s a reminder that it came from a part of the Antarctic Circumpolar Current that has been flowing underwater for 100 years or more. The only time oxygen can get mixed into water is when it’s at the surface. Once the water sinks below the surface, the oxygen slowly dissipates or gets used up by marine animals. So when the CTD shows low amounts of oxygen, it’s evidence that the water has been underwater for a long, long time.
Now that you’ve been properly introduced to MCDW, see if you can find the signs of MCDW in this graph. It shows real data from a CTD that we put in the water earlier today. Take a look, and we’ll explain it below:
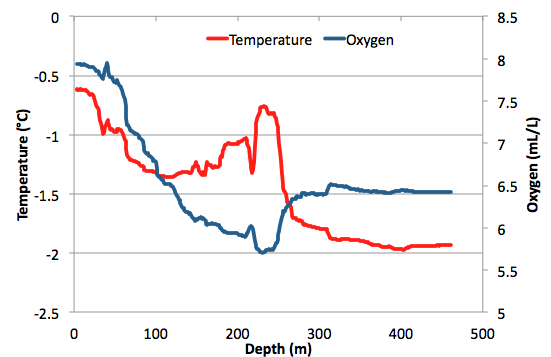
To find the telltale signs of MCDW, remember that it is
1. Not at the surface
2. Warmer than surrounding water
3. Contains less oxygen than surrounding water
The graph’s horizontal axis shows depth below the surface. The red line shows you the way that the temperature rose and fell as the CTD went down through the water. The blue line shows you how much oxygen was in the water.
From what you know about MCDW, you’re looking for a place where the temperature (red line) is high, and the oxygen (blue line) is low. If Dr. Kohut asked you how deep the MCDW was, what would you tell him? We’ll tell you the answer in Monday’s post.
(Many thanks to Dr. Phoebe Lam for making the graph and Dr. Bruce Huber for sharing his knowledge of ocean currents.)


 January 22, 2011






7 Responses to “Getting to Know MCDW”