AEZOPS in the Books
It has been almost 19 days since we deployed ru26D from the edge of the ice. In that time the glider has traveled over 436 km (271 miles). On December 18 we reached station E of the AEZOPS line and turned east. AEZOPS is a series of stations that have been sampled on previous experiments. We want the glider to follow the same line so that we can compare the Ross Sea today with the observations from previous years.
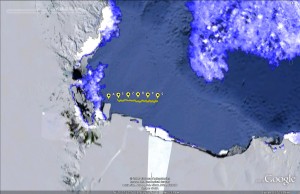
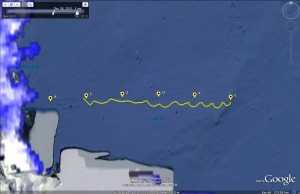
Over the next 10 days, the glider slowly made its way along the AEZOPS line to station S on Ross Bank. The exact path the glider took is shown as a yellow line below.
During this leg of the mission the glider made continuous measurements of various ocean conditions including temperature, salinity, chlorophyll concentration, dissolved oxygen and back-scatter. We are using all this information to see what the conditions are like and where we want to send the ship during the first part of the cruise this January.
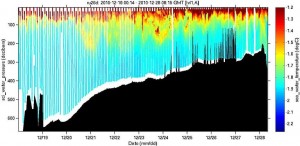
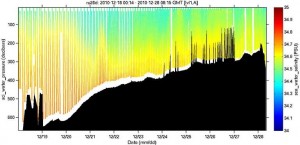
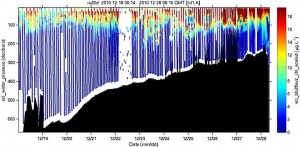
In the data plots above and below the x-axis is time and the y-axis is depth. We use black to show the location of the bottom. The colors show the range in values for the plotted variable. The plot above is temperature and the plot below is salinity. As the glider made its way to the east, you can see that the water shallowed from about 650 meters deep to 200 meters at the peak of Ross Bank. There are a few sharp changes in the bottom topography seen as black spikes. These were issues we were having with the altimeter. As you can see from the of the plot, our pilots have fixed this issue and the glider is sensing the bottom as we expect.
We use observations of temperature and salinity to identify the various masses of water in the Ross Sea and where they are located. We are particularly interested in Modified Circumpolar Deep Water (MCDW). MCDW is mid density water that makes its way onto the shelf from the deep sea. Along the way it interacts with other water masses found in the Ross Sea. We can identify MCDW by its temperature, salinity, and density. It is typically found sandwiched between less dense surface water and denser bottom water. In the plots above, we can see that as the water shallows from west to east, the depth of the warmer surface water can change dramatically. There are even a few instances where warmer water is found deeper than 200 meters.
These changes in the water characteristics are matched by similar patterns in the biology. The plot above shows the concentration of chlorophyll along the transect. Blue indicates low concentration of plants and red indicates very high concentration of plants. You can see dramatic changes in the amount and depth of this large phytoplankton bloom. There is a trend for a much deeper layer as you get to the shallow water over Ross Bank. Over the next couple weeks we will be looking at all this data to plan the ship surveys.
Now the glider is turning toward the northwest to cut across the various ridges and valleys that make-up the central part of the Ross Shelf. This section will be combined with the AEZOPS section to map the location of MCDW so we can plan the cruise in mid-January. We have less than two weeks before the ship crew heads south to meet the ship!


 December 28, 2010


Comments are closed.