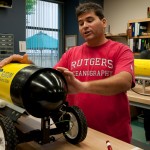
Dr. Josh Kohut presented his current research at the March 20, 2014 STEM Educators’ Series. Dr. Kohut discussed his work on the interactions between the physical and biological worlds in the ocean, how climate change is influencing these interactions, and how using ocean observing data informs us about marine ecology. During the lecture, we shared activities related to biophysical interactions as well as discuss how to bring these topics into your classrooms/clubs.
Below we have included a summary of Dr. Kohut, Background Materials, the Lecture, and adapted activities to teach on the topics of biophysical interactions, marine ecology, and climate change science as we get closer to the event.
Enjoy! The East Coast MARE Team
Dr. Josh Kohut is an Assistant Professor at Rutgers University. He received his bachelor’s degree in Phsycis and Mathematics from the College of Charleston and completed his Ph.D. in Physical Oceanography at Rutgers University. His broad research interests are in bio-physical interactions in the world’s oceans, circulation processes on continental shelves, and the impact of these processes on marine resource management. I utilize ocean observing technologies including satellites, high-frequency radar, and underwater gliding robots as part of a research program that applies ocean observations to coastal research and decision making.
Background Materials-
We have compiled the following materials as optional background information if you wish to read about the topics that will be covered during the event and included in the adapted lesson plans below (coming in March).
Glossary of terms relevant to Dr. Josh Kohut’s research and science presentation.
The Long Term Ecological Research (LTER) program down near Palmer Research Station in Antarctica is a great resource for Antarctic data, information, and publications. (Palmer LTER)
Science papers related to topics:
- Recent Changes in Phytoplankton Communities Associated with Rapid Regional Climate Change Along the Western Antarctic Peninsula Montes-Hugo, et al. Science 323, 1470 (2009)
- How Do Polar Marine Ecosystems Respond to Rapid Climate Change? Schofield, et al. Science 328, 1520 (2010)
- Ocean observatory data are useful for regional habitat modeling of species with different vertical habitat preferences Manderson, et al. Marine Ecological Progress Series 438: 1-17 (2011)
- Improving the habitat models by incorporating pelagic measurements from coastal ocean observatories Palamara, et al. Marine Ecological Progress Series 447:15–30 (2012)
- Penguin biogeography along the West Antarctic Peninsula: Testing the Canyon Hypothesis with Palmer LTER observations Schofield, et al. Oceanography 26(3):204–206 (2013)
- Adelie Penguin Foraging Location Predicted by Tidal Regime Switching Oliver, et al. PLOS One 8(1) (2013)
- Across the land-sea boundary with an IOOS informed seascape ecology supporting ecosystem management Manderson & Kohut.
- A nonmarine source of variability in Adélie penguin demography Fraser, et al. Oceanography 26(3):207–209 (2013)
- West Antarctic Peninsula: An ice-dependent coastal marine ecosystem in transition Ducklow, et al. Oceanography 26(3):190–203 (2013)
Ocean Currents:
Adelie Penguins:
Climate Change:
Evening Presentation and Discussions-
If you are interested in watching the broadcast of the event, click here: https://www.ustream.tv/recorded/45105967.
If you are interested in downloading the presentation slides, click here: Dr. Kohut’s Presentation
Activities-
We developed a packet of notes pages, data slides, and materials for participants in the program. Download Packet
Activity 1 (Models Discussion): If we were going to develop a model to investigate biological and physical connections in the ocean, what variables would we need to include?
SEP 2: Developing and Using Models:
Activity 2 (Developing Explanations from online unit): Use evidence to construct an explanation that predicts and/or describes why fish migrate, which also includes the quantitative relationships between included variables.
We will begin the activity here (https://new.coolclassroom.org/adventures/explore/fish/19) on page 19 and continue through to page 22. You can follow along in the broadcast or do it yourself on your computer.
SEP 6: Constructing Explanations and Designing Solutions:
Activity 3 (Asking Questions from the Data): Using the data, is there a relationship between the variables? Develop a question to investigate the data further.
Temperature (degrees C): Fall 1993, Spring 1993, Fall 2002, Spring 2002
NOAA Fisheries Trawl Data (Catch Per Unit Effort): Fall 1993, Spring 1993, Fall 2002, Spring 2002
Temperature and Trawl Data: Fall 1993 .png, Spring 1993 .png, Fall 2002 .png, Spring 2002 .png; Fall 1993 .avi, Spring 1993 .avi, Fall 2002 .avi, Spring 2002 .avi
SEP 1: Asking Questions and Defining Problems:
Activity 4 (Data Interpretation): Use the maps to identify temporal and spatial relationships in phytoplankton along the Western Antarctic Peninsula.
Montes-Hugo et al. 2009 Data: Remote Sensing
Vemet et al. 2008: Ship Observations
SEP 4: Analyzing and Interpreting Data:
Activity 5 (Simulation & Analysis): Collect data through the simulation to serve as the basis for evidence to answer the question: what effects where predators forage?
This activity is from the draft lesson “Penguin Foraging: Where and Why?” that is part of the Project CONVERGE. To receive a copy of the lesson contact Kristin.

