When we think of the holidays, perhaps the last thing that comes to mind is real-time data. But the truth is, the holidays are filled with data. Here are just a few data questions you might pose to yourself this year:
Is my flight on time?
- How many holiday cards will I receive or send this year?
- When will my package arrive? And why the heck is it stuck in Knoxville?
- And perhaps most asked of all: Will it be a white Christmas?
The fact is, the holidays are filled with data, real-time and otherwise, and no where is this more apparent than in the retail industry. Store managers and company executives follow their sales data closely, analyzing year-to-year results and looking for trends, trying to devise ways (i.e. through the use of coupons, sales and last-minute deals) to entice as many customers as possible to hopefully increase their profits.
But of course, retailers don’t publicize their data, so we can’t use it in the classroom. Our budding future marketers and sales reps will have to wait. In the meantime, they’ll have to play with datasets that some might consider more fun anyway, that is, data from the environment.
But it is possible to celebrate the holidays using real-time environmental data? Well, to prove it can be done, here’s one quick idea that also has wonderful history and geography tie-ins.
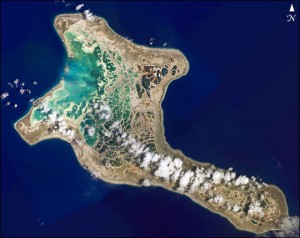
Christmas Island (or more properly called Kiritimati) lies near the Equator in the middle of the Pacific Ocean. It was discovered in 1777 on Christmas Eve (go figure) by none other than Captain James Cook. The Island served as a weather station and rest stop for planes traveling to the South Pacific during World War II and was the site of several nuclear bomb tests during the 1960’s. Not only is the Island named for the Christmas holiday, but an adjustment to the International Date Line in 1995 means the island is now the first inhabited place on Earth to bring in the New Year.
A) Real-time Data Project
For those of us who live in the Northern Hemisphere, particularly above 30N, we tend to associate Christmas with winter and cold weather. Of course, for the Southern Hemisphere, December 22 will be the first day of Summer, and for those who live along the Equator, well… they won’t notice much of a change in seasons at all. A great way to emphasize the variability of seasons over the globe is to study real-time weather data or archived climate averages.
As it turns out, the National Weather Service maintains a weather buoy off the coast of Christmas Island.
http://ndbc.noaa.gov/station_page.php?station=51028
For a quick activity, students can compare real-time weather data (i.e. air & water temperatures, wind speeds and presure) from Christmas Island with a second buoy closer to them. As an extension, students can choose several buoys from across the globe, looking at the differences in real-time data between each, while trying to describe why those differences exist. A full listing of real-time buoys can be found here:
http://ndbc.noaa.gov/rmd.shtml
If you wish to delve further, one of the nice features about the NDBC Buoy site is that on the bottom of each buoy’s page you can find a link to “Historical Data & Climatic Summaries.” From here, you have quick access to historical data files that you can quickly load into Excel and plot.
More importantly, also available on these pages are “Climatic summary plots” for each buoy, which are pre-made box plots that show monthly averages of each meteorological variable. For studying the seasonal variability of temperature, winds and waves at each station, these plots are perfect starting points. They’re also useful for easily putting real-time values within their climatic context.
B) Engaging Questions
Here are a few questions students can think about before they start their research.
- What temperature do you think the atmosphere and ocean’s surface are this time of year 1) near here and 2) along the equator?
- Why does the Weather Service have a buoy in the middle of the Pacific Ocean?
- How many people live on Christmas Island? What is the population density? How do they get their food and water?
- Do seasons vary in different parts of the world?
C) Suggested Research Questions
- What is the current temperature of the air and ocean near Christmas Island? How does that compare with where we are?
- Has the temperature or winds changed at all during the past week?
- What does the seasonal cycle of temperature, winds and waves look like? What factors might cause this annual pattern?
- Do the current conditions differ much from those expected from the climatic averages?
- Compare the annual patterns in the measured data (temperature, winds, etc.) between two or more buoys in different locations. What differences are there between the plots, and what factors might cause those differences?
D) Relevant References
Wikipedia entry on Kiritimati (Christmas) Island
http://en.wikipedia.org/wiki/Kiritimati
Data Tips #2 and #3 on the site below contain more information on using climate and ocean data for student research projects.
http://marine.rutgers.edu/outreach/urbanadvantage/
If you already discuss El Nino in your lessons, you can also point out that the Christmas Island buoy is right in the middle of the TAO observing array which is used to monitor El Nino conditions. There’s a wealth of information on the net about El Nino, and here is just one page of educational resources.
http://www.cdc.noaa.gov/ENSO/enso.education.html
If you have any thoughts or suggestions on how to make this activity better, please share. I’d also especially like to here from any of you that use some of these ideas with your classes.
Happy Holidays
Originally written December 15, 2006


Comments are closed.